We visited Inniskeen on both days and we used the River Fane to demonstrate the Citizen Science Stream Index on Saturday 17 September. The river was just above its 50th percentile flow (the flow that is exceeded 50% of the time) and was fast flowing so it was not possible for everyone to take their own samples due to safety issues. Martin showed how to take a kick sample for macroinvertebrates and gathered sufficient material to allow for the CSSI score to be calculated.
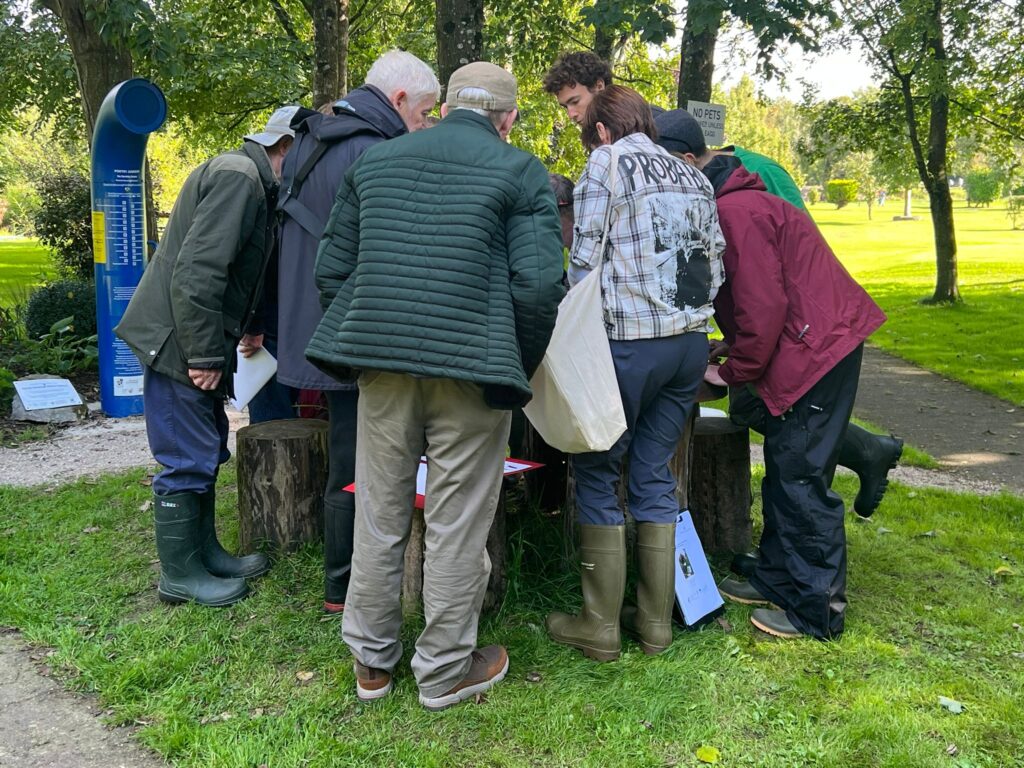
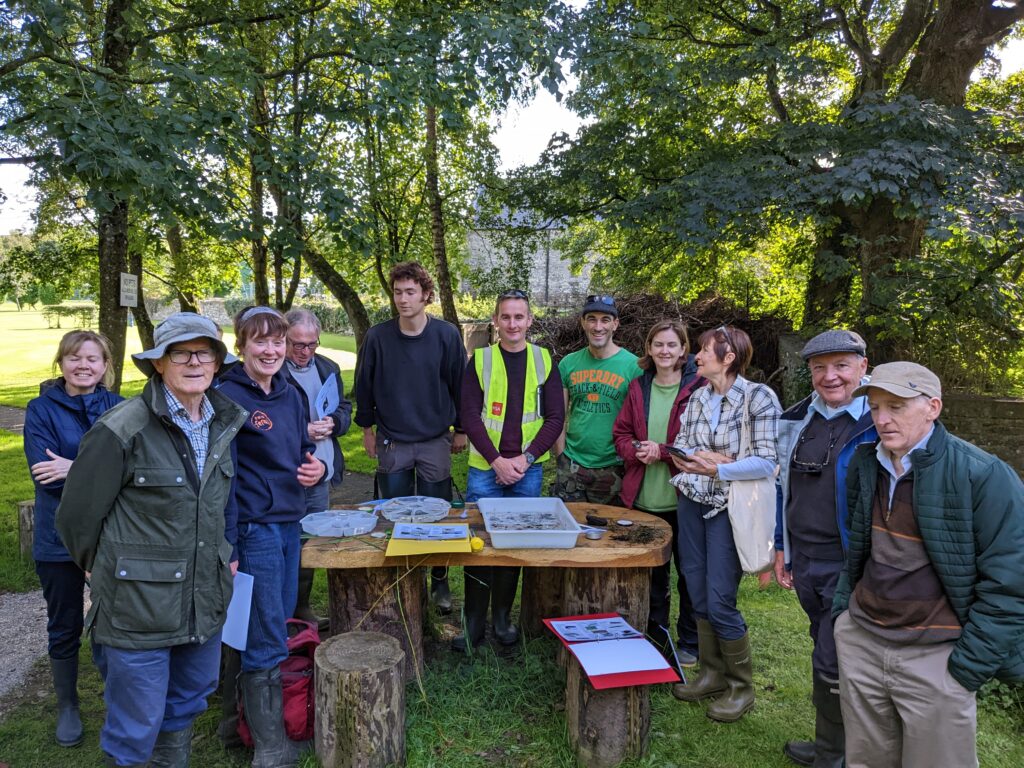
When calculating the CSSI, in the positive scoring ‘Good Guys’ category we had flattened mayflies (in quite good abundance), and the green caddis fly (Rhyacophila), but no stoneflies. On the other end of the scale, we had two of the ‘Bad Guys’ which score negatively – a few snail species and the water louse Asellus but no leeches, balanced the two positives giving an overall score of zero for the site and classifying it as being in moderate condition.
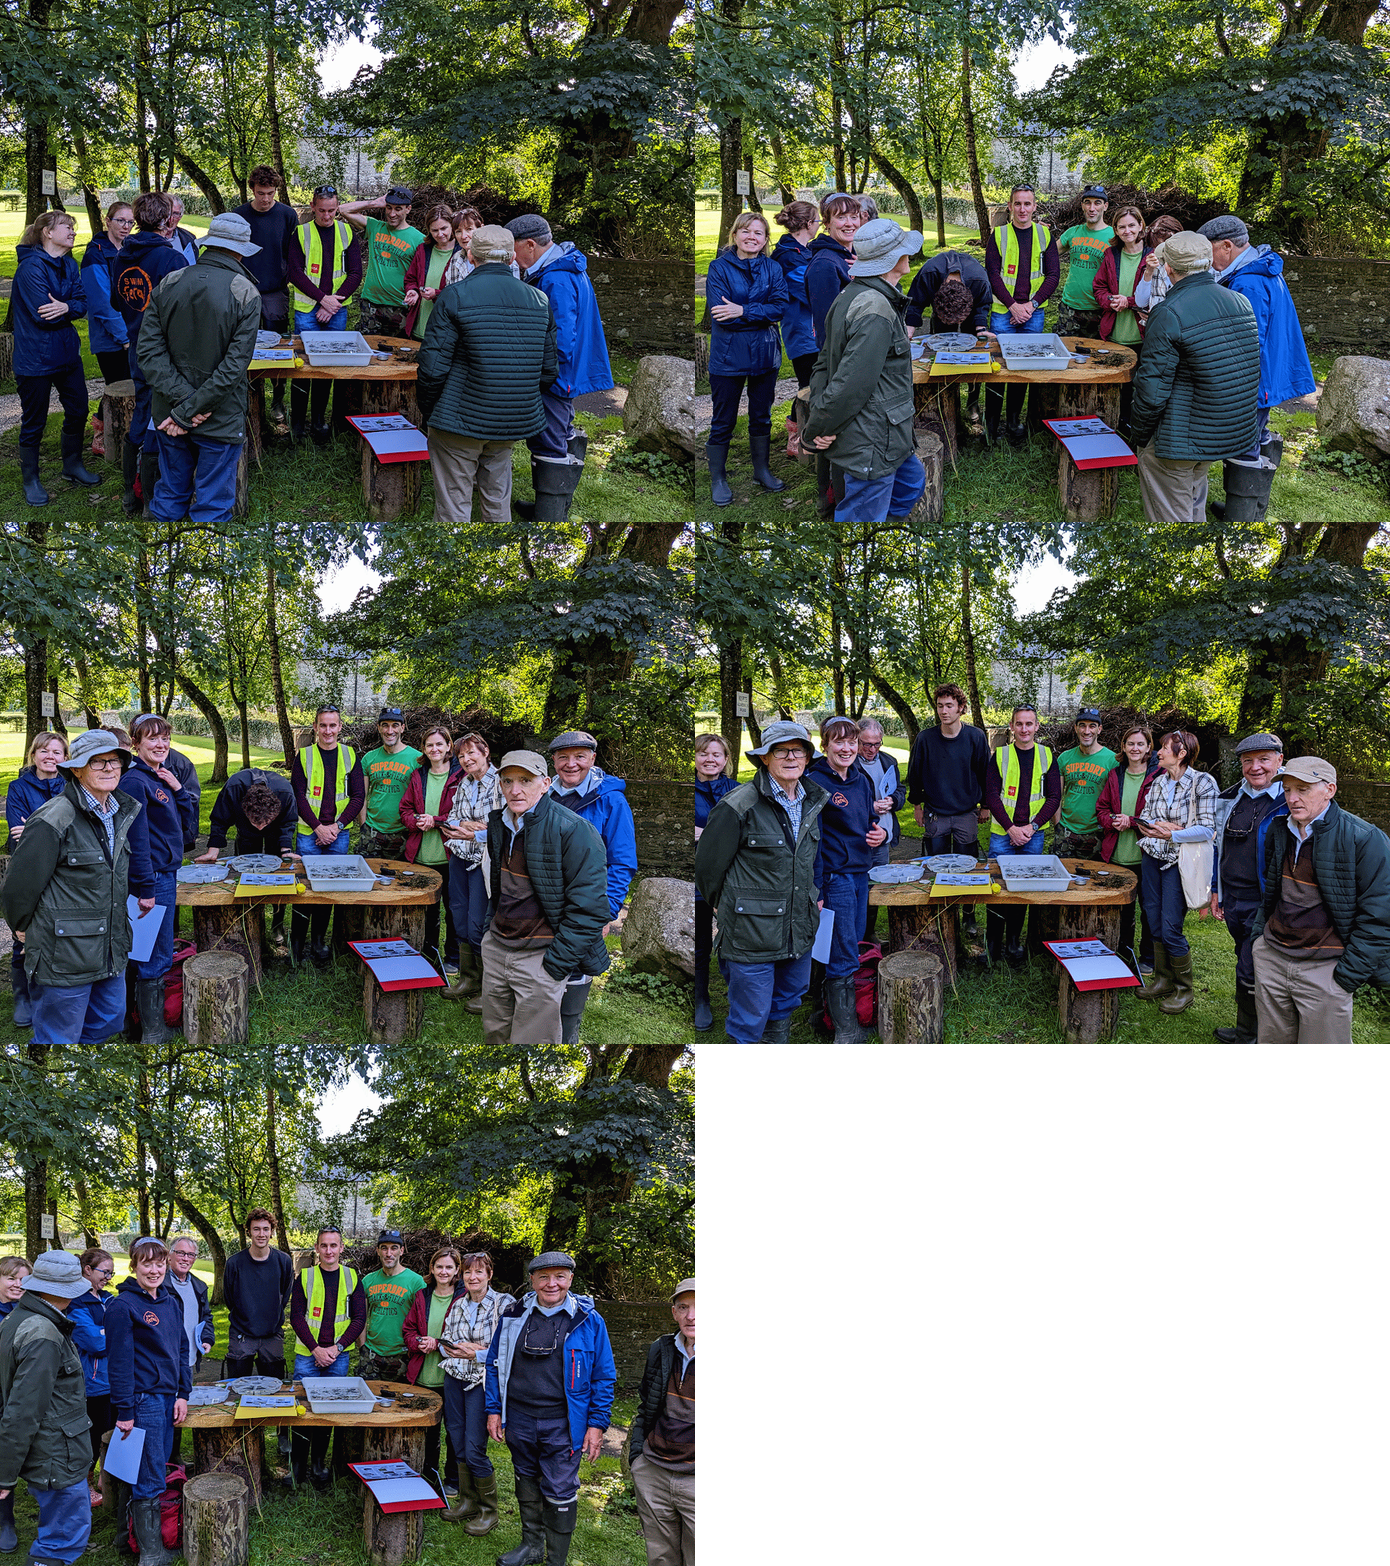
We also covered health and safety in and near water and demonstrated the wearing of a life jacket.
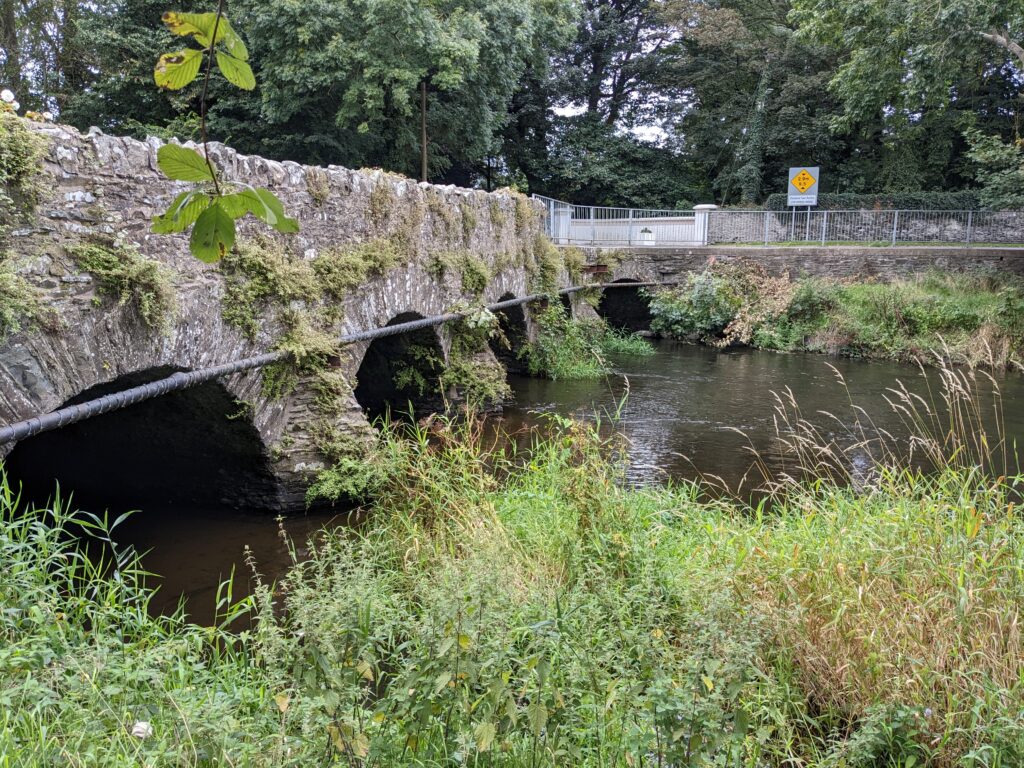
On the second day’s visit on Sunday 18 September, we dealt with the river’s oxygen and chemistry, and we also measured the flow or discharge of the river in terms of tonnes of water passing the bridge every second.
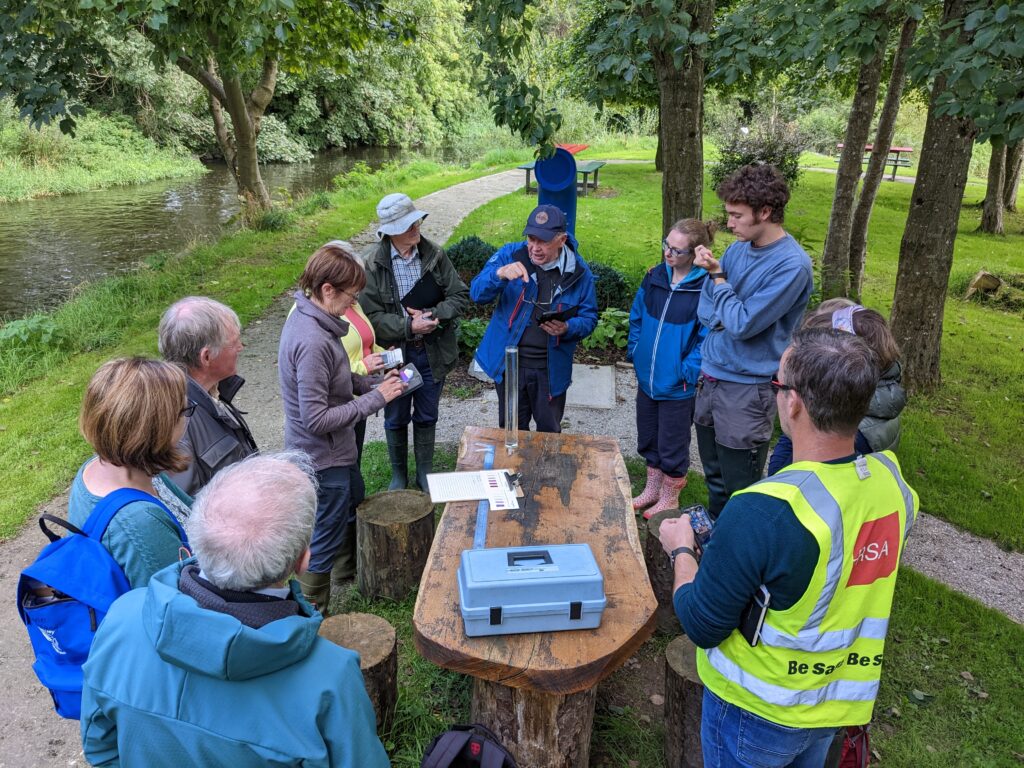
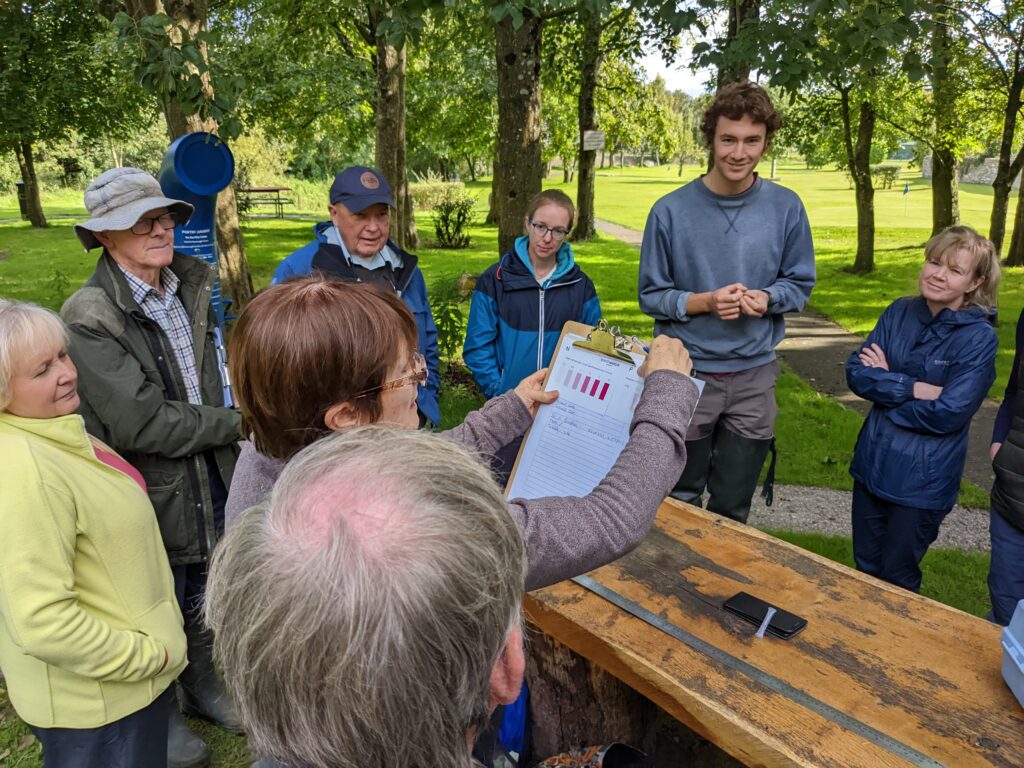
Bernie demonstrated the used of a citizen science kit for measuring nitrate and phosphate in freshwaters. She added a carefully measured volume of water to transparent tubes that contain white powders, i.e. the active colour-producing reagent and left for 3 or 5 minutes depending on the test – 5 minutes for phosphate and 3 minutes for nitrate. We then compared the colour that developed against a colour card, comparing the strength of the colour that developed to six bands of increasingly darker tones in order to estimate the phosphate or nitrate concentration of the water. We concluded that the levels were in the 0.02 to 0.05 mg/l phosphate and similarly low for nitrate. DCU distributes these kits for the regular WaterBlitz campaigns involving citizen scientists.
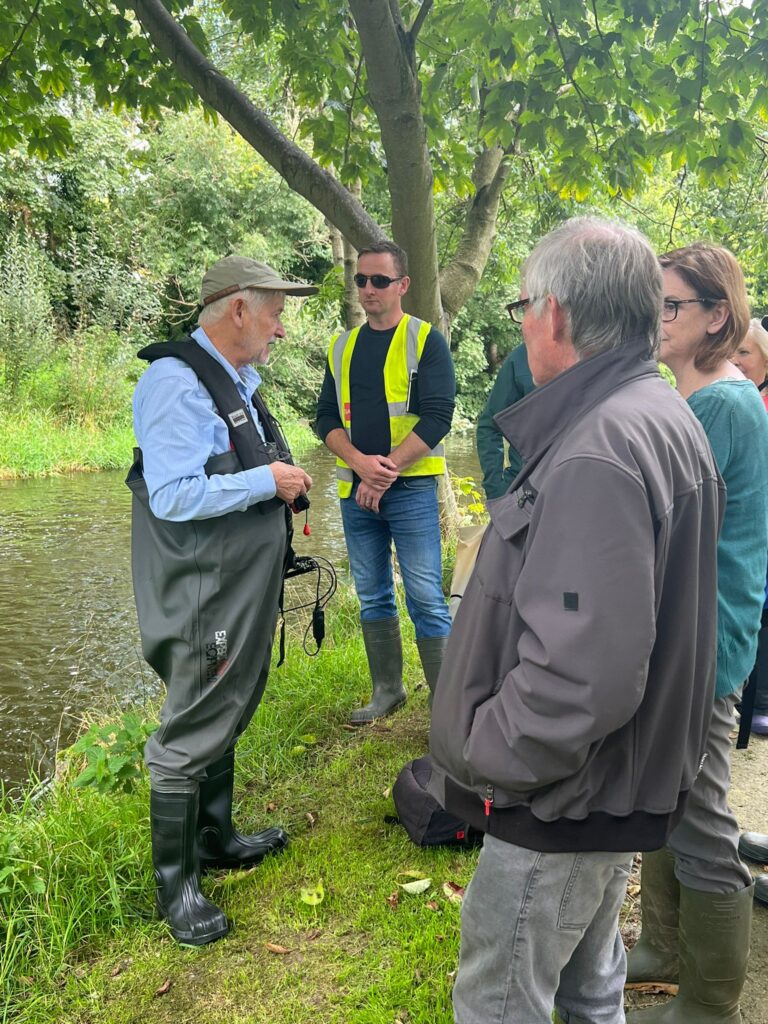
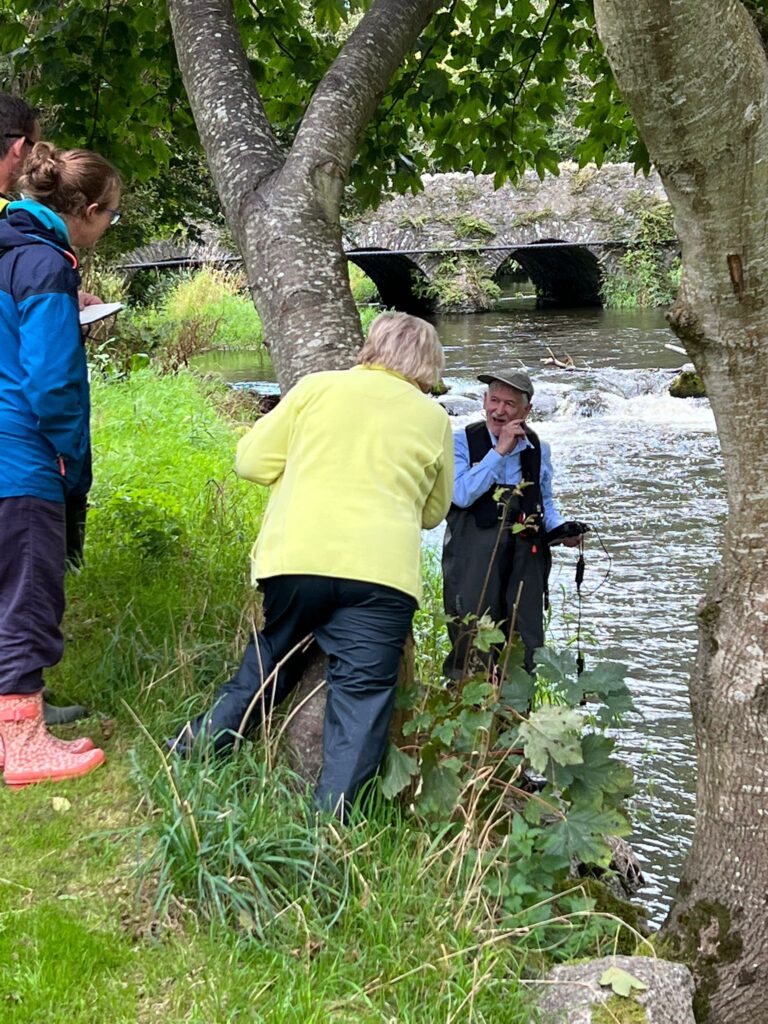
Martin demonstrated an oxygen meter and explained the concept of dissolved oxygen and percentage saturation – the amount of oxygen dissolved in water is temperature dependent with colder water holding more than warm water. Each water temperature has an oxygen concentration value that is taken as 100% saturation (atmospheric pressure is also considered as water holds more oxygen at higher pressures). Plants producing oxygen may push the level above 100% saturation during the day or pull it below 100% at night when respiration dominates, using oxygen. Bottom muds may also use significant amounts of oxygen. When we measured the oxygen in the Fane just below the weir the oxygen level was 9.99 mg/l at the water temperature of 16.5 °C – this gave a percentage saturation 101.6%. This means that every litre of water flowing downstream had close to 10 milligrams of oxygen dissolved in it.
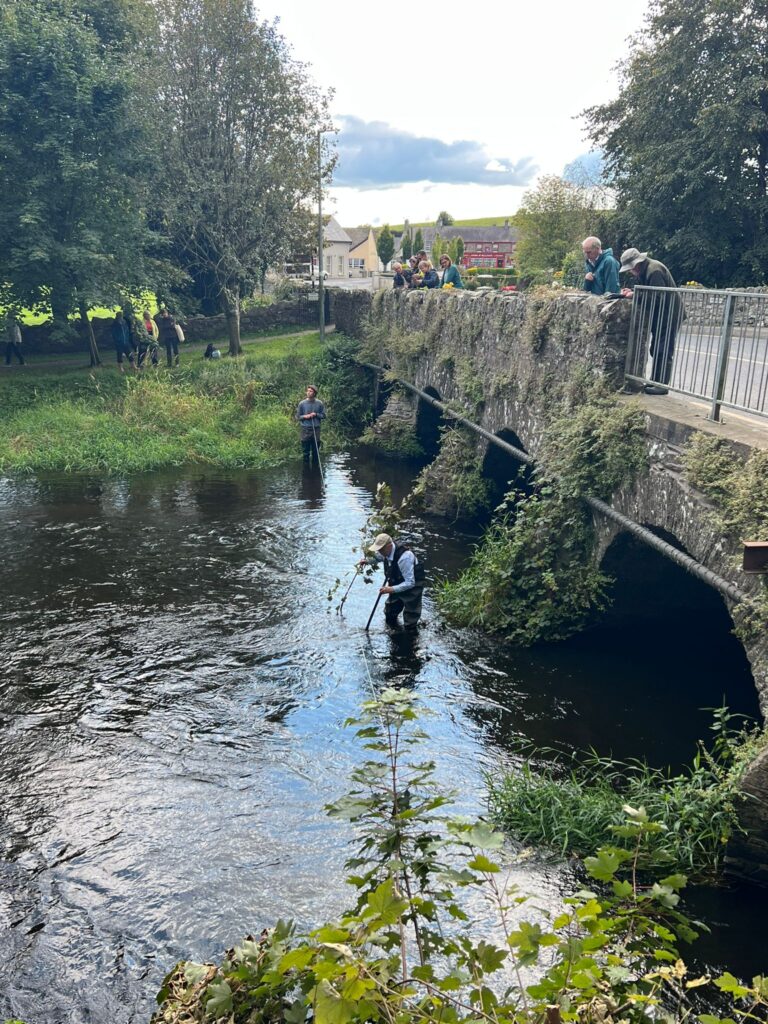
We demonstrated how to measure the volume of water flowing downstream – using a tape measure, meter stick, orange and stop-watch. We estimated the cross-sectional area as approximately 6 m2 by taking some 34 depth measurements at 50 cm intervals.
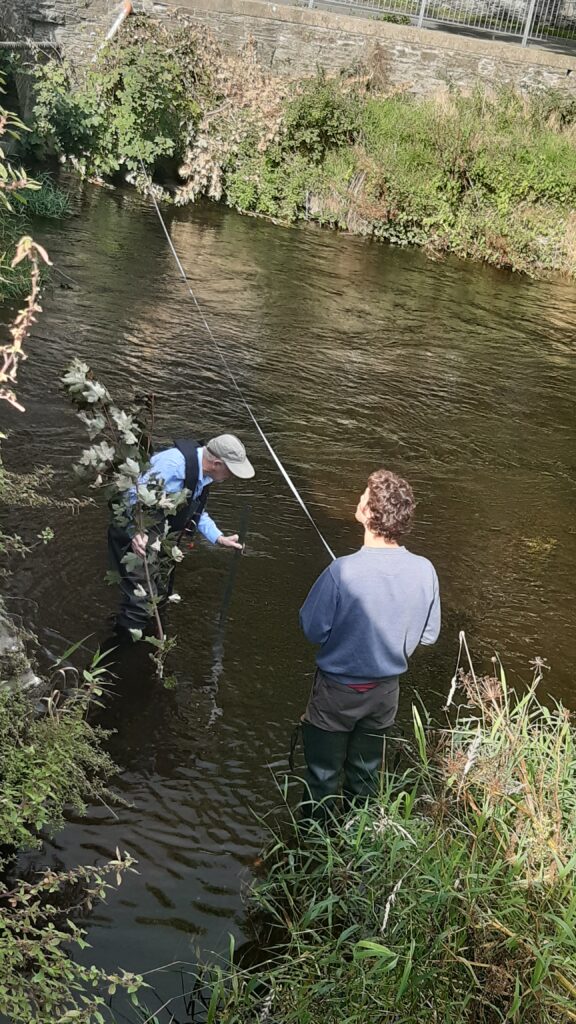
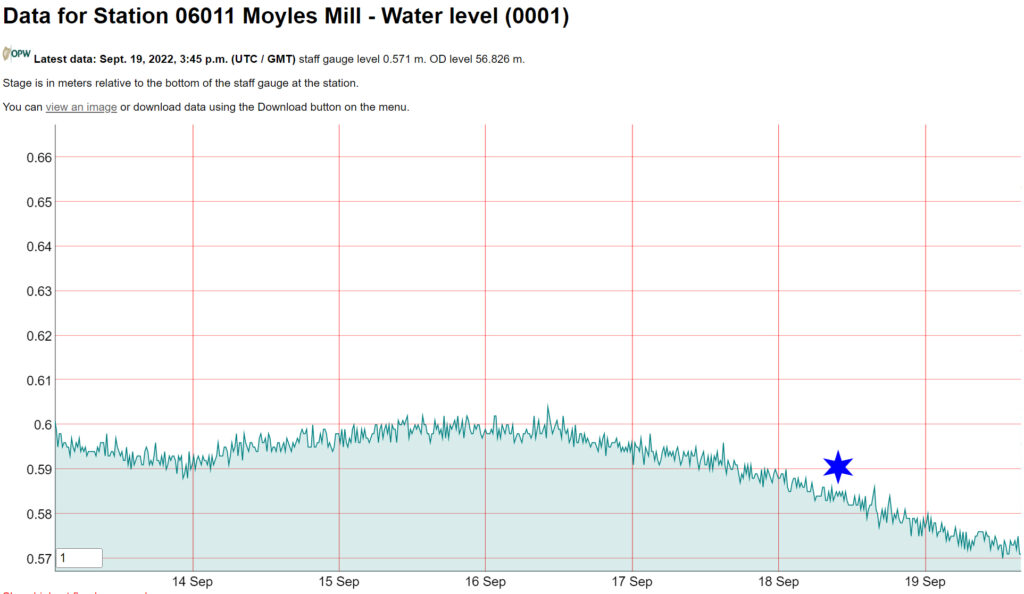
We then measured the velocity over 5 m using an orange and a stopwatch. The orange took an average of just under 9 seconds to travel the 5m giving a water speed of ~5.6 m/s. Multiplying the cross-sectional area (square metres) by the velocity (metres per seconds) gives cubic metres per second and the final estimate was 3.4 m3/s i.e. 3.4 tonnes of water or 3,400 litres flowing under the bridge every second. The orange floats just below the surface and will over-estimate the overall velocity of water – the official flow measured at the nearest gauge was just over 2.7 m3/s.

Ken briefly discussed the weirs on this stretch of the Fane in terms of fish passage – trout and salmon would not have a problem passing upstream but other species may not be able to pass them.